

Is your steam system burning money faster than a coal-fired locomotive? You’re about to find out. The gap between theoretical perfection and actual performance is where thousands of dollars vanish into thin air—or more accurately, into wasted heat.
Back in 1824, a French engineer named Sadi Carnot figured out the maximum efficiency any heat engine could ever achieve. He wasn’t working with supercomputers or fancy software. Just brilliant thinking during the Industrial Revolution’s steam-powered chaos.
Here’s the uncomfortable truth: real engines only reach about 70% of Carnot’s theoretical limit. Friction eats your fuel budget. Turbulence steals your thermodynamic efficiency. Heat leaks through every imperfect seal.
Why should you care about these calculations? Because understanding the difference between ideal and actual steam efficiency reveals exactly where your operation bleeds cash. That knowledge transforms from academic theory into practical cost savings.
Let’s dive into the math that separates fantasy from financial reality.
Inputs fuel heat to steam work at shaft electric output
Every power plant has a story: heat goes in, work comes out, and money goes missing. The difference between these numbers is where engineers make their money.
Let’s follow the thermal energy flow from fuel to electricity. This journey is all about energy conversion. It’s about turning chemical bonds into electricity, fighting physics at every turn.
Fuel releases heat through burning or nuclear reactions. Engineers call this heat input, or Qh. This heat turns water into steam, making angry water molecules push turbine blades.
Those turbines spin, and when connected to a generator, electricity is made. Sounds simple, but it’s not.
But then, reality hits the efficiency party. At every step, energy leaks away. The process goes like this:
- Fuel combustion releases chemical energy as heat
- Heat transfers to water in the boiler, creating high-pressure steam
- Steam expands through turbine blades, converting thermal energy to mechanical rotation
- Turbine shaft drives the generator rotor
- Generator converts mechanical work to electrical power
Temperature is key. In nuclear reactors, water at 300°C heats steam to drive turbines. The steam then cools at 27°C. This temperature difference is your efficiency limit, thanks to the Carnot cycle.
Coal, oil, and gas plants can get hotter. This isn’t just bragging. Higher temperatures mean better efficiency, no matter the fuel.
| Plant Type | Hot Side Temperature | Cold Side Temperature | Typical Efficiency Range |
|---|---|---|---|
| Nuclear (PWR) | 300°C | 27°C | 32-36% |
| Coal (Subcritical) | 540°C | 30°C | 35-40% |
| Combined Cycle Gas | 1400°C | 35°C | 55-62% |
| Supercritical Coal | 600°C | 30°C | 42-48% |
I once visited a coal plant where the manager said, “That’s where half our money goes.” He wasn’t kidding. Knowing this energy conversion cascade is key to improving efficiency.
And you can’t improve what you don’t measure. Some heat escapes up the stack. Some gets lost in metal casings. Some goes into cooling water.
This section shows the journey from chemical bonds to electricity. It’s a map for finding efficiency gains. The thermal energy flow is more than just theory—it’s a guide to finding lost fuel dollars.
Think of your fuel bill as untapped energy. Your electric meter shows the energy you get. The gap between is where you can save or waste, depending on your mood.
Improving efficiency by just 1% saves a lot of fuel. But, physics is strict, and the second law of thermodynamics always takes its cut.
Measure power Prony brake or generator volts × amps
Every engineer wonders: how much work does this thing do? Power measurement turns steam theory into real numbers. Without it, efficiency is just a guess.
The Prony brake is a Victorian device that looks like it’s from a steampunk story. It clamps a brake on a spinning shaft. Weights on a lever measure the torque as the engine spins.
The math is easy. Multiply torque by speed, and you get power. Watching the weights balance shows brake power in action.
Dynamometer testing with a Prony brake is useful today. It’s mechanical, visual, and shows the engine’s force directly.
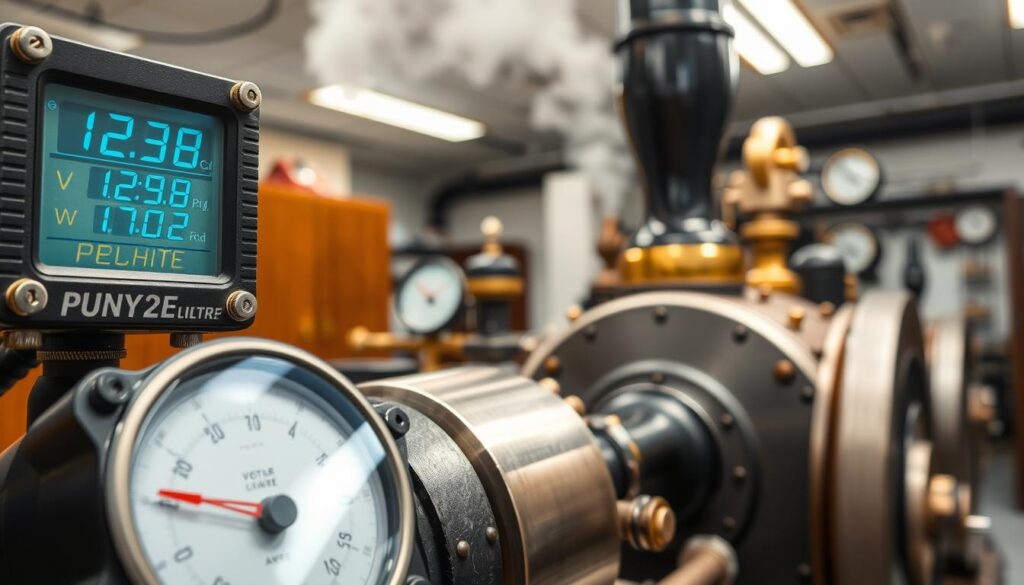
Most places today use electrical output instead. They use a simple formula: volts times amps equals watts. This formula gives precise data with just multiplication.
For systems with generators, electrical output measurement is precise. Calibrated meters measure voltage and amperage. Multiply these to find the shaft output in electricity. Losses are known and predictable.
But, accuracy is key. I’ve seen places with old voltage meters. Garbage in, garbage out, as engineers say.
Knowing the output is critical. It’s the numerator in your efficiency equation. A small error in measurement can make big differences in efficiency claims.
| Measurement Method | How It Works | Best Applications | Key Limitations |
|---|---|---|---|
| Prony Brake | Friction brake with weighted lever arm measures torque; multiply by RPM for power | Direct shaft testing, educational demonstrations, engines without generators | Requires mechanical setup; heat dissipation; limited to lower power outputs |
| Electrical Metering | Voltage × amperage measurement at generator terminals calculates watts | Generator-coupled systems, continuous monitoring, high-power applications | Doesn’t capture mechanical losses between shaft and generator; requires calibration |
| Hydraulic Dynamometer | Water resistance absorbs power while measuring torque and speed | High-power testing, consistent load simulation, research applications | Complex setup; water cooling required; expensive equipment |
| Eddy Current Dynamometer | Electromagnetic resistance provides adjustable load with electronic measurement | Variable load testing, precise control, automotive and industrial applications | High initial cost; requires electrical power; sophisticated control systems |
Knowing both mechanical and electrical methods helps spot data issues. If brake power and electrical readings don’t match, there’s a problem. It could be calibration or conversion losses.
The choice of measurement method depends on your setup and needs. Schools often use mechanical dynamometer testing for hands-on learning. Industrial settings prefer electrical output measurement for its ease and continuous monitoring.
Accuracy, repeatability, and documentation are key in power measurement. Approximations or “close enough” engineering don’t cut it. Your efficiency calculations depend on accurate measurements.
Always verify your data, even with basic physics and a calibrated meter. Reporting wrong numbers is as useful as a chocolate teapot at a thermodynamics conference.
Stack loss thermometer calc radiation estimates
Let’s talk about the elephant in the boiler room—all the ways your fuel budget evaporates into thin air. Dissipative processes are the reality check that brings your steam system crashing down from Carnot’s theoretical heights to the messy world of stack loss, radiation, and conduction. Understanding these losses isn’t just academic; it’s the difference between burning money and running an efficient operation.
The biggest culprit? Hot gases shooting up your chimney like they’re late for an appointment with the atmosphere.
Every cubic foot of exhaust gas leaving your stack carries thermal energy that you paid for but never used. The flue gas temperature tells the story—measure it with a simple thermometer, and you’ve got your first clue in the efficiency mystery. If your stack temperature reads 450°F when ambient air sits at 70°F, that 380-degree difference represents pure waste.
The heat loss calculation follows straightforward thermodynamics. Multiply the mass flow rate of exhaust gases by their specific heat capacity and the temperature difference. Most operators don’t have flowmeters on their stacks, so they estimate flow from fuel consumption and combustion stoichiometry. It’s not perfect, but it beats ignoring the problem entirely.
I’ve watched engineers argue over whether stack temperatures above 300°F matter. They matter. They matter a lot.
Here’s the painful arithmetic: every 40°F increase in stack temperature typically wastes about 1% of your fuel energy. Run that exhaust at 400°F instead of 280°F, and you’re throwing away 3% of your fuel budget before anyone even turns a valve. The concept objectives of efficient steam generation include minimizing these preventable losses through better combustion control and heat recovery.
Radiation losses represent the sneakier thief in your efficiency equation. Hot surfaces—boiler casings, steam pipes, valve bodies—radiate heat like miniature suns warming everything except your process. You can feel this waste by walking past uninsulated steam lines; that warmth on your face is money evaporating in real time.
Calculating radiation losses gets technical fast. The Stefan-Boltzmann law says radiated power scales with the fourth power of absolute temperature. Double the surface temperature (in Kelvin), and radiation increases sixteen-fold. Most practical engineers skip the physics headaches and use empirical charts that estimate losses based on surface area, temperature, and insulation thickness.
The low-tech approach works surprisingly well. Walk around with an infrared thermometer and a notepad. Map every hot surface. Estimate the area. Look up the loss factor in a reference table.
I remember one facility that discovered their bare steam headers were radiating 15 kilowatts continuously—enough to power fifteen space heaters nobody wanted. Adding two inches of fiberglass insulation cost $800 and saved $2,400 annually in fuel. The payback period was four months, yet those pipes had been heating the warehouse for seven years.
Conduction losses through insulation follow similar patterns but on a smaller scale. Even the best insulation conducts some heat. The trick is making the thermal resistance high enough that losses become negligible compared to stack and radiation waste.
| Loss Source | Typical Temperature Range | Percentage of Fuel Input | Detection Method |
|---|---|---|---|
| Stack Loss | 250°F – 500°F exhaust | 10% – 25% | Flue gas thermometer |
| Radiation Losses | Surface temps 150°F – 300°F | 2% – 8% | Infrared camera or contact thermometer |
| Conduction Through Insulation | Outer surface 80°F – 120°F | 1% – 3% | Surface temperature survey |
| Blowdown and Condensate Losses | Near steam temperature | 2% – 6% | Flow measurement and temperature |
These losses add up faster than you’d expect. A system with 15% stack loss, 5% radiation losses, and 3% in other thermal leaks has already surrendered 23% of its fuel input before mechanical friction and electrical losses even enter the picture. Your theoretical Carnot ceiling might promise 40% efficiency, but real-world dissipation cuts that in half before the turbine sees a single BTU.
The good news? These losses are measurable, quantifiable, and often fixable without exotic technology. A thermometer, some insulation, and better combustion tuning can reclaim 5-10% of your fuel budget. That’s not theoretical—that’s money returning to your bottom line every single operating hour.
Becoming a heat loss detective doesn’t require a PhD. It requires curiosity, a few basic instruments, and the willingness to face uncomfortable truths about where your energy actually goes. Most facilities discover that their biggest efficiency gains come not from revolutionary technology but from plugging the obvious thermal leaks they’d been ignoring for years.
Carnot efficiency 1 − Tc Th for class temps ceiling
Meet the Carnot efficiency formula, the equation that tells every power plant designer exactly how much they’re allowed to dream. This isn’t some suggestion from a consultant you can ignore. It’s the hard limit imposed by physics itself.
The Carnot cycle gives us the maximum theoretical efficiency any heat engine can achieve. The formula is beautifully simple: Eff_C = 1 – (Tc/Th). Tc represents your cold temperature, Th your hot temperature, both measured in Kelvin.
That absolute temperature scale matters a lot. You can’t cheat by switching to Fahrenheit when the numbers look bad.
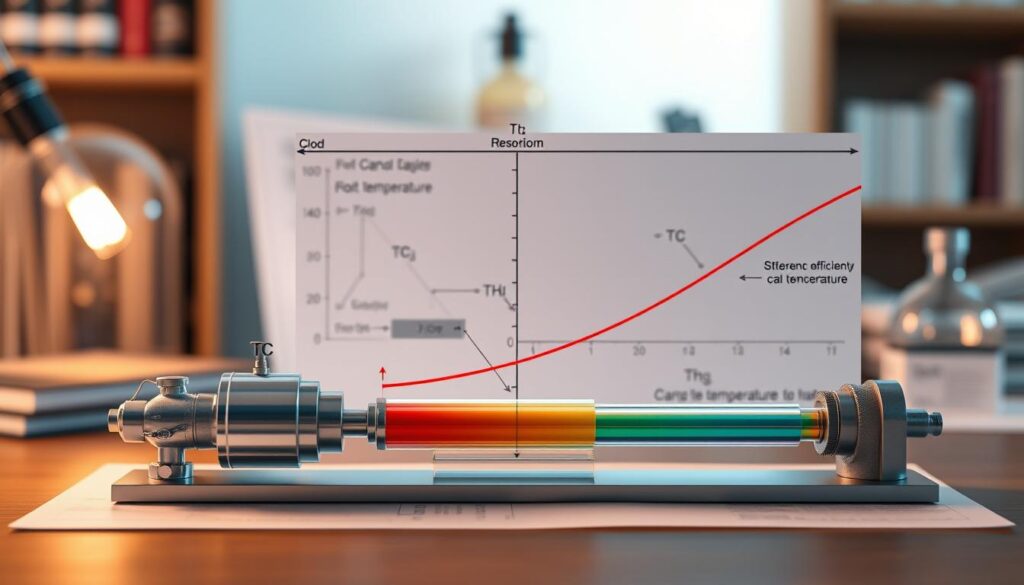
Let’s run a maximum efficiency calculation for a nuclear reactor. Your core operates at 573 K (300°C), and your condenser runs at 300 K (27°C). Plug those numbers in: 1 – (300/573) = 0.476, or 47.6%.
That’s the ceiling. The absolute best you could possibly do, even with perfect materials and zero friction.
Real nuclear plants achieve around 35% efficiency. Before you start firing engineers, do the math. That’s 74% of the theoretical efficiency maximum, which is honestly impressive given real-world constraints like turbine friction, heat loss, and the fact that materials actually have to survive operating conditions.
Coal and gas plants smugly achieve higher efficiencies, around 42%. They’re not staffed by superior engineers. They simply operate at higher temperatures because combustion flames exceed nuclear core temperature limits set by material safety concerns.
The formula reveals something profound about the quest for 100% efficiency. Getting there requires Tc to equal 0 K—absolute zero, where atoms stop moving. Good luck building a condenser that operates at -273°C while surrounded by Earth’s atmosphere.
| Power Plant Type | Hot Temperature (Th) | Cold Temperature (Tc) | Carnot Maximum | Actual Efficiency |
|---|---|---|---|---|
| Nuclear Reactor | 573 K (300°C) | 300 K (27°C) | 47.6% | 35% |
| Coal Plant | 873 K (600°C) | 313 K (40°C) | 64.2% | 42% |
| Combined Cycle Gas | 1,673 K (1,400°C) | 313 K (40°C) | 81.3% | 62% |
You’ve got exactly two levers to improve efficiency, and the Carnot cycle equation makes them crystal clear:
- Increase Th: Run your boiler or reactor hotter. Limited by material strength, safety regulations, and whether your pipes melt.
- Decrease Tc: Cool your condenser further. Limited by local water temperature, ambient air temperature, and thermodynamic reality.
The cold side usually proves stubborn. Your condenser can’t drop below whatever cooling water you’re pumping in from the river or ocean. Unless you’re planning to relocate your power plant to Antarctica, that environmental constraint isn’t negotiable.
The hot side offers more flexibility. Modern combined-cycle gas turbines push Th past 1,400°C, which is why they achieve theoretical efficiency levels near 81% Carnot maximum. Their actual 62% efficiency represents the best we’ve managed in commercial power generation.
Understanding this ceiling transforms how you evaluate performance. That nuclear plant at 35% isn’t failing—it’s capturing 74% of what physics allows. Setting realistic improvement targets means respecting these temperature limits instead of chasing impossible dreams.
The second law of thermodynamics doesn’t negotiate, compromise, or accept bribes. It simply states the rules. Every engineer who works with steam learns this lesson eventually. The smart ones learn it early and focus their efforts on maximizing performance within the possible, not arguing with fundamental physics.
Compare real vs ideal gap friction throttling heat loss
The gap between theoretical maximum and actual steam efficiency is clear. It’s a list of thermodynamic crimes. The difference between what Carnot says you could achieve and what your gauge actually reports? It’s where engineering theory meets the messy, expensive reality of metal, steam, and entropy.
Every real steam system operates with irreversible processes that Carnot’s elegant model ignores. Carnot assumes perfect insulation, frictionless motion, and infinite time for heat transfer—luxuries your plant doesn’t have. Real efficiency always falls short because actual engines live in a universe governed by the second law of thermodynamics, where entropy always increases and perfection is thermodynamically prohibited.
Start with friction losses, the most obvious culprit. Metal slides against metal in bearings, pistons drag through cylinders, and steam rushes through pipes with turbulence that would make a fluid dynamics professor weep. Each contact point, each flow restriction, each vibration converts organized mechanical energy into random thermal motion—translation: your expensive work becomes cheap waste heat.
Throttling losses deserve special mention because they’re simultaneously necessary and destructive. When you reduce steam pressure through control valves—convenient for managing flow and temperature—you’re performing an irreversible expansion. The steam doesn’t do useful work during throttling; it just loses pressure while maintaining enthalpy. That’s thermodynamic inefficiency with a control engineering justification.
Turbulence in piping systems represents another hidden tax on efficiency. Smooth, laminar flow is theoretically ideal but practically impossible at industrial flow rates. Instead, you get chaotic eddies and vortices that dissipate kinetic energy as heat. The faster you need to move steam, the worse this gets—a cruel catch-22 for high-throughput systems.
Non-equilibrium processes occur whenever your system moves faster than thermodynamics can comfortably handle. Rapid expansions in turbines, quick compressions in pumps, sudden heat transfers across temperature gradients—these all generate extra entropy beyond the theoretical minimum. Understanding thermodynamic cycles helps explain why slower, more reversible processes would be more efficient, even if they’re commercially impractical.
Heat losses through components add insult to injury. Despite insulation, your boiler radiates energy to the surroundings, your pipes leak heat along their entire length, and your turbine casing conducts thermal energy away from where you need it. I’ve watched engineers wrap every surface in increasingly exotic insulation materials, fighting a battle against the second law one BTU at a time.
Even peripheral equipment compounds the problem. That generator converting mechanical shaft work to electricity? It’s 95-98% efficient on a good day, meaning 2-5% of your hard-won mechanical energy vanishes in electromagnetic losses. Transformers, transmission systems, mechanical gearboxes—each adds another percentage point to the efficiency gap.
| Loss Mechanism | Primary Location | Typical Energy Impact | Root Cause |
|---|---|---|---|
| Friction losses | Bearings, seals, turbine blades | 3-7% of input energy | Surface contact and viscous drag |
| Throttling losses | Control valves, pressure reducers | 2-5% per throttling stage | Irreversible pressure drop without work extraction |
| Turbulence dissipation | Piping, fittings, bends | 1-3% of flow energy | Chaotic flow patterns at high Reynolds numbers |
| Heat transfer losses | Boiler, piping, turbine casing | 5-12% of thermal input | Temperature gradients and inadequate insulation |
| Non-equilibrium processes | Rapid expansions/compressions | 2-4% efficiency penalty | Insufficient time for reversible state changes |
A coal plant hitting 42% steam efficiency when Carnot calculations suggest 60% might be theoretically possible? That 18-percentage-point canyon represents specific, identifiable, and—critically—potentially reducible losses. This isn’t academic hand-wringing; it’s a roadmap for improvement.
The gap between ideal and real efficiency exists because we build steam systems in the real world, not in thermodynamics textbooks. But understanding exactly where those losses hide—friction, throttling, turbulence, heat leakage, non-equilibrium processes—transforms a vague efficiency problem into a concrete engineering challenge. Some losses you can reduce. Others you’ll live with. Knowing the difference? That’s where the money is.
Upgrade levers insulation superheat condensate recovery leaks
The gap between your steam system and the best possible performance is not set in stone. You’ve seen how far off you are from perfection. Now, it’s time to take action.
Insulation is key, but it’s not the most exciting topic. Upgrading insulation can pay off in just a few months. I’ve seen places spend big on new gear but ignore the heat radiating from pipes.
Insulating those hot pipes is a no-brainer. Every meter of exposed pipe at 200°C wastes a lot of energy. The cost of materials is a drop in the bucket compared to the energy lost every hour.
Superheat can make your steam work harder. Raising the boiler’s pressure and temperature seems simple. Yet, many run well below what their equipment can handle. This is because they chose “safe” over “efficient” a long time ago.
Material science sets the limit, but few reach it. An extra 50°C of superheat can significantly improve efficiency.
The cold side is just as important. Optimizing condenser temperature is often ignored. Lowering it by just 5°C can make a big difference without touching the boiler.
To lower condenser temperature, improve cooling water flow and clean heat exchangers. A fouled condenser wastes a lot of energy. Yet, cleaning it means shutting down, so it’s often ignored.
Condensate recovery is a must. Wasting that hot condensate is like throwing away free boiler feedwater. Systems that recover condensate can boost efficiency and cut water costs.
Condensate exits near saturation temperature, often 80-100°C. Using cold makeup water at 20°C means your boiler must add a lot of heat. Recovering condensate gives you free feedwater heating, saving energy and money.
Leaks are a big problem. Steam leaks are visible waste that can be fixed. Yet, many ignore them for months, saying they’ll fix them later.
A single 3mm leak wastes about 15 kg of steam per hour. At typical steam costs, that’s a lot of money lost every day. Find and fix those leaks.
| Improvement Strategy | Typical Efficiency Gain | Implementation Cost | Payback Period |
|---|---|---|---|
| Insulation upgrades on exposed pipes | 2-4% | Low ($5-15k) | 3-8 months |
| Superheat temperature increase | 3-6% | Medium ($20-50k) | 1-2 years |
| Condenser temperature optimization | 2-5% | Low to Medium ($10-30k) | 6-18 months |
| Condensate recovery systems | 4-8% | Medium to High ($30-100k) | 1-3 years |
| Steam leak repairs | 1-3% | Very Low ($2-10k) | 1-4 months |
Focus on these efficiency improvements in order:
- Quick wins: Fix visible steam leaks and add insulation to bare pipes—low cost, immediate returns
- Medium-term projects: Optimize condenser performance through cleaning schedules and cooling water improvements
- Strategic investments: Implement condensate recovery systems and evaluate superheat upgrades
- Long-term planning: Consider major equipment replacements only after exhausting operational improvements
Material limits and safety rules set the temperature ceiling. But most operations are far from it. The gap between your current and maximum efficiency is waste you can cut. Start with the cheap fixes, measure everything, and invest more as results show.
Spreadsheet for energy balance Sankey sketch
Energy balance spreadsheets make thermodynamic theory practical. They track every BTU like a budget line item. Without structure, numbers are just chaos.
A good spreadsheet turns raw data into useful insights. It shows your steam efficiency clearly.
The first law of thermodynamics is key: energy in equals energy out. No exceptions. Your spreadsheet must track every energy stream.
It starts from fuel entering the boiler to heat rejection in the condenser.
Here’s what your thermal accounting ledger needs to track:
- Fuel heat input (Qh) – The total energy content of coal, gas, or oil burned
- Useful work output (W) – Shaft power delivered to your generator or mechanical load
- Stack losses – Energy escaping up the chimney with hot exhaust gases
- Radiation losses – Heat bleeding through pipes and equipment surfaces
- Condenser heat rejection (Qc) – Waste heat dumped into cooling water
- Miscellaneous losses – Blowdown, leaks, and other thermal fugitives
Set up columns for each energy stream and rows for measurement timestamps. Build formulas to calculate efficiency automatically. I’ve seen plants waste months arguing about efficiency when a simple spreadsheet would settle the debate in five minutes.
| Energy Stream | Measurement Method | Typical Percentage | Update Frequency |
|---|---|---|---|
| Fuel Input | Flow meter × heating value | 100% (baseline) | Continuous |
| Shaft Work | Generator output or brake test | 25-35% | Continuous |
| Stack Loss | Flue gas thermometer + calculation | 10-20% | Hourly |
| Condenser Rejection | Cooling water flow × temperature rise | 40-55% | Continuous |
| Radiation & Misc | Calculation by difference | 5-10% | Daily |
But spreadsheets alone won’t convince skeptical managers to fund improvements. Enter the Sankey diagram—the infographic that makes energy waste impossible to ignore. This heat flow visualization uses arrow widths proportional to energy quantities, creating a brutally honest picture of where your fuel budget disappears.
Picture a fat arrow entering from the left representing total fuel input. As energy flows through your system, progressively thinner arrows branch off: stack loss peels away, radiation bleeds off, friction takes its cut. What remains—often a disappointingly skinny arrow—represents your actual useful work output.
The visual impact is devastating. Corporate executives who’d sleep through efficiency presentations suddenly wake up when you show them a Sankey diagram where 60% of the input arrow vanishes before reaching output. It’s the difference between abstract percentages and visceral understanding.
Building your Sankey requires methodical energy accounting. Every measurement feeds into the diagram with mathematical precision. Start with fuel heat input as your 100% baseline. Subtract each loss category, sizing the corresponding arrow proportionally. The remaining flow becomes the next stage’s input.
I recommend creating templates that pull data directly from plant instruments. Real-time updates teach you more than static reports ever could. Watch efficiency drop when you throttle steam unnecessarily. See stack losses spike when combustion air gets misadjusted. The cause-and-effect relationships become obvious when visualized properly.
Modern spreadsheet software makes this surprisingly manageable. Set up your energy balance calculations in one tab, feed the results into Sankey diagram generators in another. Tools like Excel with add-ins or dedicated energy management software can automate the entire workflow. Update your measurements, and the diagram refreshes automatically.
The payoff extends beyond technical understanding. When you present that Sankey diagram to your CFO showing where half the fuel budget evaporates, suddenly that insulation project gets approved. The boiler tune-up receives funding. Management stops viewing maintenance as an expense and starts seeing it as investment in efficiency.
Because ultimately, energy balance isn’t just thermodynamics—it’s financial transparency. Your spreadsheet translates abstract steam efficiency into dollars lost or saved. The Sankey diagram turns those dollars into a picture worth a thousand budget justifications.
Competition idea teams test changes and report percent gain
The secret to better performance isn’t new gear—it’s team competition. I’ve seen maintenance teams turn into efficiency fanatics. They argue over the best blowdown rates at lunch.
Here’s how it works: split your team into groups, each tackling a different system. Challenge them to find ways to improve efficiency. It’s a simple yet effective way to boost performance.
But there’s a catch: you need accurate baseline measurements before starting. Bad testing at the beginning can ruin everything. Teams must trust the numbers, so measure everything carefully.
People get excited about improving efficiency. They start testing new ideas, like better feedwater temperatures. It turns skeptics into efficiency champions in no time.
Set clear rules and scoring for your competition. Give teams four weeks to make changes. They can try new procedures, maintenance, or even small upgrades.
After the changes, measure everything again. Use the same methods to find the percentage gain. Document any improvements, like better brake power or fuel use.
What makes a competition successful is learning from it. Teams should explain their changes and what they learned. Even failed ideas teach valuable lessons.
Track results in a way everyone can understand:
| Team | Change Implemented | Baseline Efficiency | Final Efficiency | Percent Gain |
|---|---|---|---|---|
| Boiler Squad | Optimized excess air ratio | 72.3% | 75.1% | +2.8% |
| Steam Team | Repaired trap leaks, insulation | 68.5% | 71.9% | +3.4% |
| Turbine Crew | Improved condensate recovery | 70.2% | 72.8% | +2.6% |
| Process Group | Reduced throttling losses | 69.8% | 71.5% | +1.7% |
Share the results and celebrate the wins. Analyze what didn’t work. This approach turns efficiency into a team goal with rewards. It’s a powerful way to improve performance and build a culture of continuous improvement.
Careers efficiency auditor operator process engineer
You’ve cracked the thermodynamics code. Now what? Turn that knowledge into a paycheck that doesn’t disappear into heating bills.
Understanding steam efficiency opens doors across multiple industries. The efficiency auditor role pays you to walk into facilities and identify wasted energy. You measure, calculate, recommend improvements. Companies need this expertise because most plants burn money they don’t have to.
Plant operators who grasp efficiency principles control systems in real-time. They adjust steam pressure, manage combustion rates, optimize feed water temperatures. These decisions directly impact the bottom line.
Process engineering takes the design perspective. You create systems that achieve maximum output from minimum fuel input. Carnot principles aren’t just theory here. They’re specifications.
Energy management roles coordinate facility-wide improvements. You track consumption patterns, prioritize upgrades, justify capital investments. The Certified Energy Manager certification helps. So does Certified Energy Auditor status.
The economics work in your favor. Companies cut energy costs whether the economy booms or tanks. Regulations keep tightening. Carbon prices keep rising. Someone who can quantify waste and eliminate it? That person stays employed.
Energy careers reward people who think systematically about heat, work, and efficiency. The math you’ve learned here translates directly into value you can sell. Most facilities leave performance on the table. Your job is finding it.
